

What are the LEAF and ZONE Indicators?

The LEAF and ZONE look intimidating but are simple to use.
Our entire trading system is based on the LEAF.
The LEAF is a visual representation of a strategy and uses fancy maths.
You dont need to know said fancy maths.
You just have to know where to click to find trades.
What seems complicated at first is often just a collection of simple steps. - Mr. LEAF
What is the ZONE Indicator?
Are you tired of using complex trading tools that give you ADHD? What about finding and copying simple opportunities from the past? What if there was a simple, powerful tool that could reveal these setups instantly? Well, we wanted the same thing. So we built it.
Picture this: you start your day with confidence. Your bills are covered, your financial goals are within reach, and instead of drowning in charts for hours, you simply click a dip on a chart in the past and then click FIND TRADES. Instantly, a curated list of potential similar opportunities appears. You swipe a few that look ready to move and save them to track.
But before we jump ahead of ourselves. Let's learn about the first important bit of our trading system. The ZONE.
So what is the ZONE?
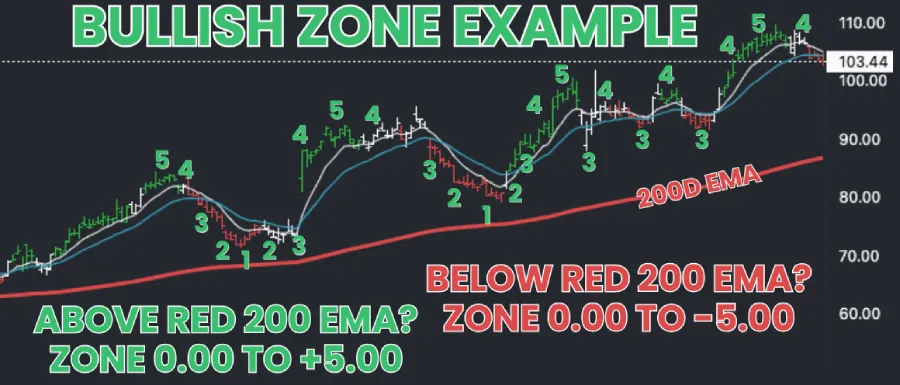
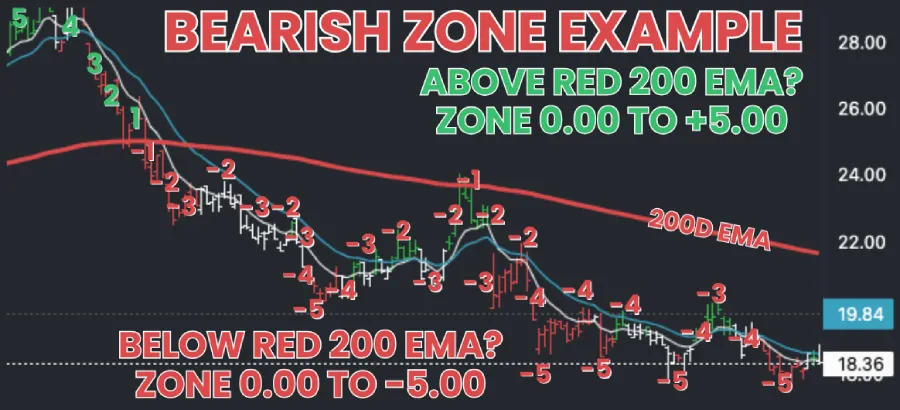
- ZONE number negative?, it is in a long term bear.
- ZONE number positive?, it is in a long term bull.
- ZONE near -5.00, the asset is "oversold" and is either in a raging BEAR DIP or is in a potential long term BOTTOM area.
- ZONE near +5.00, it’s "overbought." and is either in a raging BULL RIP or is in a potential long term TOP area.
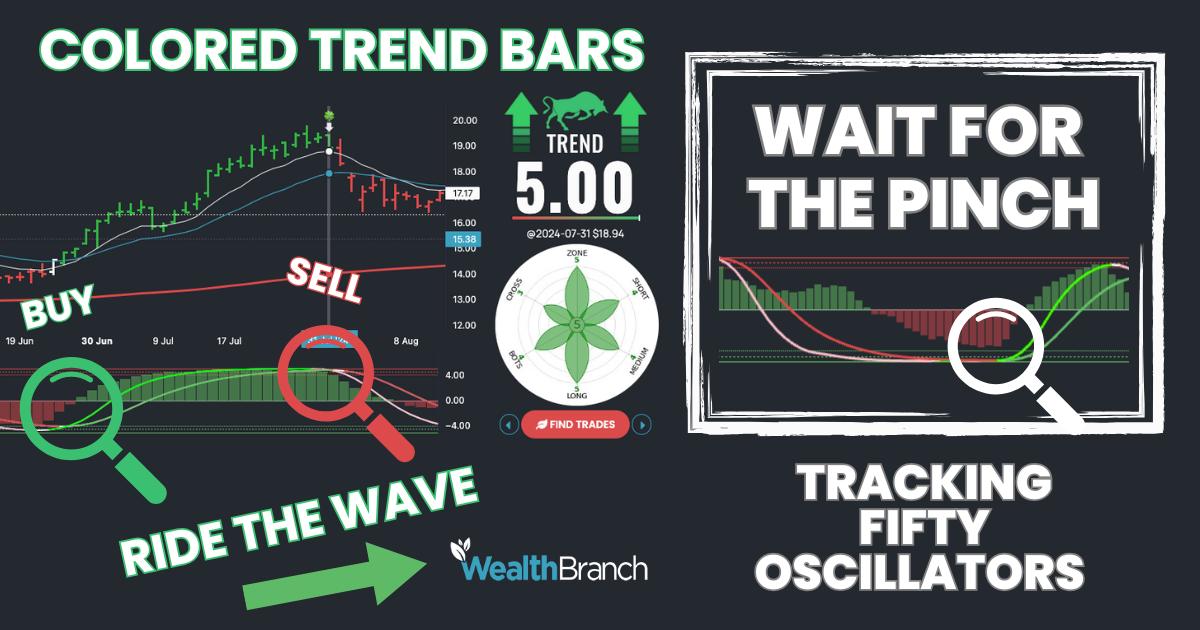
Above our ZONE number in our app, you can see SHORT TERM signals which also are represented on the chart as COLORED BARS. This tells you whether the asset is rising, falling, or staying flat. It uses three labels with matching colors:
- Green Bars (+Bull Icon): Trend is up. Don't sell short green bars.
- White Bars (Bull vs Bear): Trend is flat and indecisive or transitioning.
- Red Bars (-BearIcon): Trend is down. Don't buy red bars.
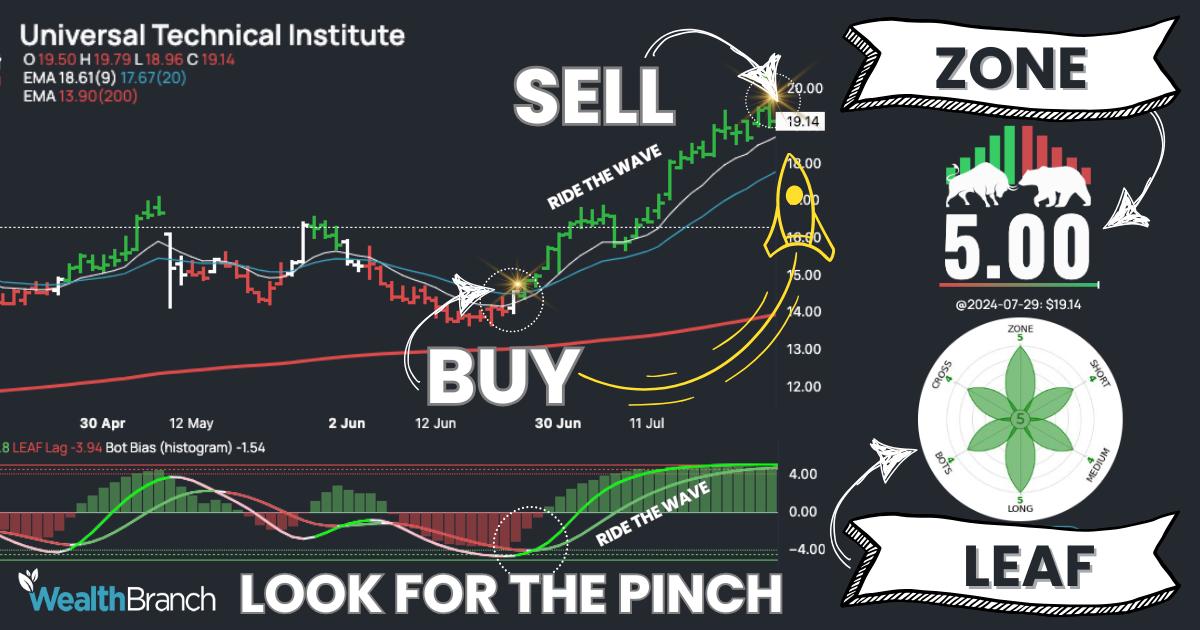
What is the LEAF Indicator?
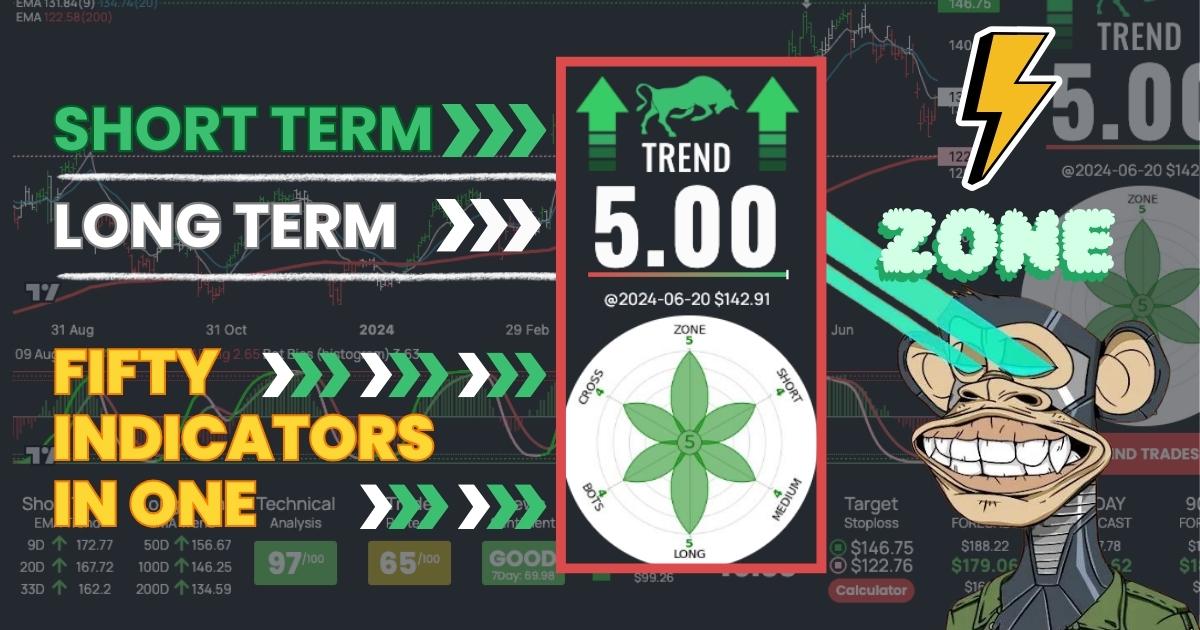
The LEAF indicator isn’t just another tool. It’s a game-changer that checks over 50 traditional and custom indicators like RSI, MACD, and many others and considers price action to show if a stock is overbought or oversold.
You don’t need to know all the details, but the more you use WealthBranch, the more familiar you’ll become with common LEAFs for your trade setups. You can save your favorite setups or share them with friends.
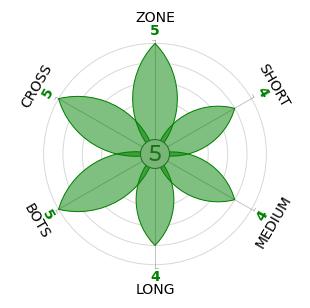
The LEAF has six points on the circle:
- ZONE Number (top and also in the center)
- Short-Term Trend
- Medium-Term Trend
- Long-Term Trend
- 25 Bot Indicators (tracking liquidity)
- 25 Cross-Over Indicator (tracking the pinch and turn)
How the LEAF Indicator Unlocks More Trades
I was making hundreds of thousands using a strategy called the "Knife Catcher," but I wasted hours analyzing charts, looking for more trades. I got frustrated with tools that didn’t help, so I created my own. I can now click a dip on a chart and find "Knife Catchers" in seconds not hours.
Most traders struggle because they don’t know what to buy and when. I developed scripts to automate my stock-picking process, focusing on one tool—the LEAF Indicator. It removed guesswork and saved me hours. The LEAF Indicator helps traders find trades by clicking similar setups on charts in the past.
We love the 200 Day EMA
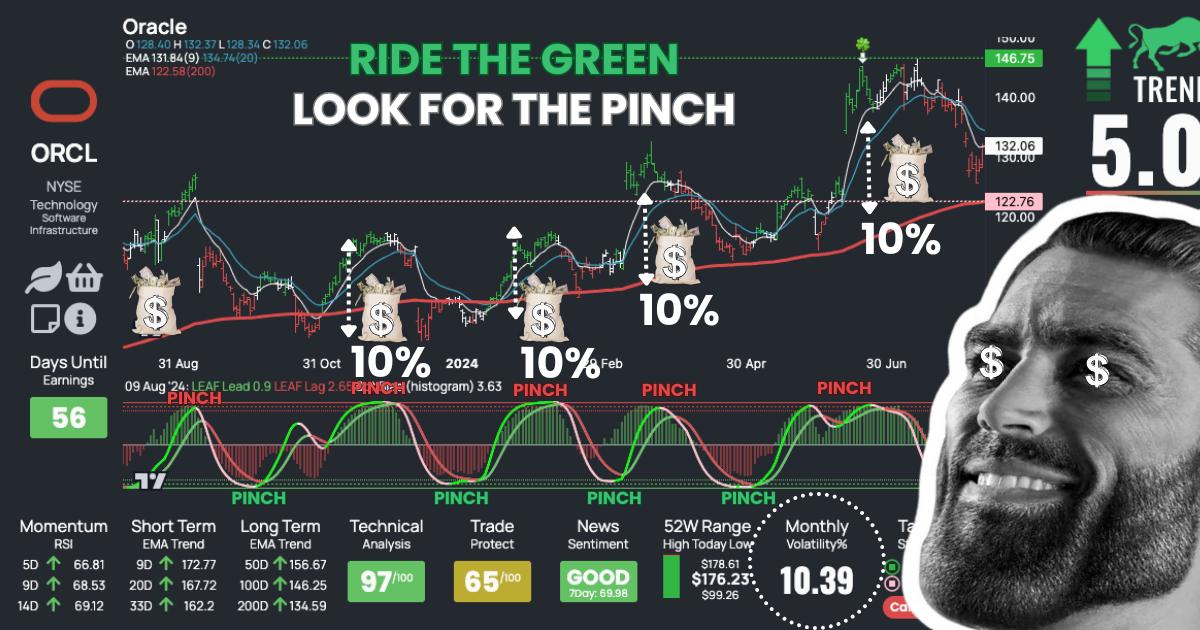
On our charts, the solid red line represents the 200-day Exponential Moving Average (EMA). This line often acts as a "support" level when stock prices are above it, meaning traders bet the price won't drop below it.
- Above the Line: When a stock approaches the 200-day EMA, don’t assume it will hold. Traders usually look for confirmation or multiple bounces off the line.
- Below the Line: If a stock is below the EMA, the line can act as resistance, pushing the price back down.
- Learn more about the 200-Day EMA
Our Oscillators
On the bottom of our charts, you'll find two oscillators and a histogram.
- Histogram: This is tracking 25+ trading bots AND 25+ crossover indicators. You can think of this like a turn in liquidity. You want to front run the bots when they all begin flipping direction.
- DIP ZONE (-5 to -4 Area): When both oscillators touch this area, the price is usually oversold (underpriced). Never sell short in this area unless you hate money and want to see how fast you can get liquidated.
- RIP ZONE (+5 to +4 Area): When both oscillators touch this area, the price is usually overbought (overpriced). Never buy in this area as the odds of a pull back are generally imminent.
In the next lesson, we will learn how to find trades with it.